| Year (period) | |||
|---|---|---|---|
| 2009/10 (2009-11-10--2010-08-31) | |||
| Selection of the report | |||
| Degree Project in Construction Management and Industrial Engineering | |||
| Number | Part | ||
| Number of respondents + response rate | 14 | 67% | |
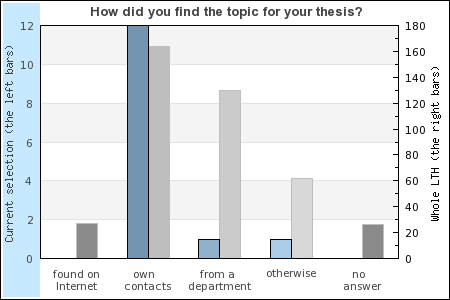
The blue bars to the left is the current selection (LTH / course / programs) and the gray bars to the right represents all responses from LTH for the same period.
| Number | Part | ||
|---|---|---|---|
| Found on Internet | 0 | 0% | |
| Own contacts | 12 | 86% | |
| From a department at LTH | 1 | 7% | |
| Otherwise | 1 | 7% | |
| No answer | 0 | 0% |
| Number | Part | ||
|---|---|---|---|
| Yes | 13 | 93% | 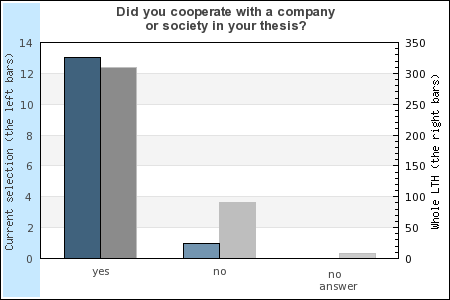 |
| No | 1 | 7% | |
| No answer | 0 | 0% |
| Number | Part | ||
|---|---|---|---|
| Not at all relevant | 0 | 0% | 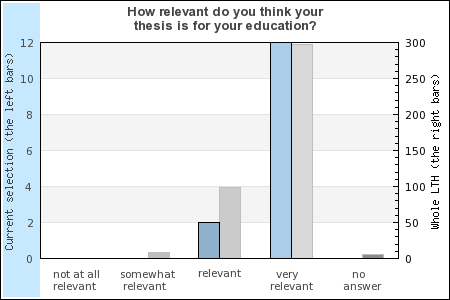 |
| Somewhat relevant | 0 | 0% | |
| Relevant | 2 | 14% | |
| Very relevant | 12 | 86% | |
| No answer | 0 | 0% |
| Number | Part | ||
|---|---|---|---|
| 10-15 | 0 | 0% | 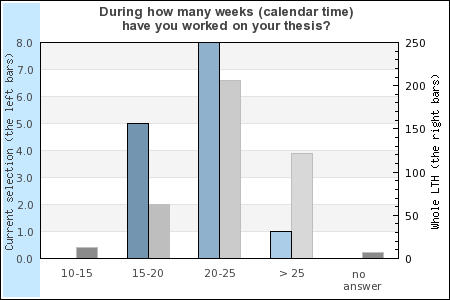 |
| 15-20 | 5 | 36% | |
| 20-25 | 8 | 57% | |
| > 25 | 1 | 7% | |
| No answer | 0 | 0% |
| Number | Part | ||
|---|---|---|---|
| 25 % | 0 | 0% | 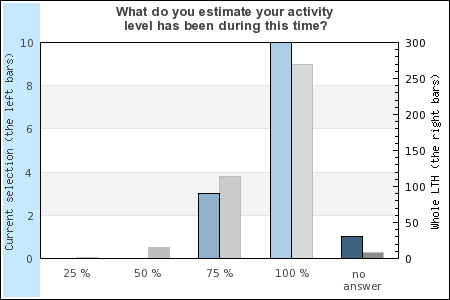 |
| 50 % | 0 | 0% | |
| 75 % | 3 | 21% | |
| 100 % | 10 | 71% | |
| No answer | 1 | 7% |
| Number | Part | ||
|---|---|---|---|
| < 5 | 6 | 43% | 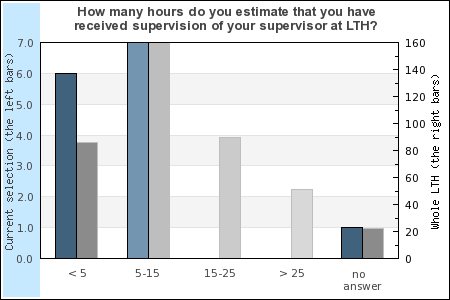 |
| 5-15 | 7 | 50% | |
| 15-25 | 0 | 0% | |
| > 25 | 0 | 0% | |
| No answer | 1 | 7% |
| Number | Part | ||
|---|---|---|---|
| None | 0 | 0% | 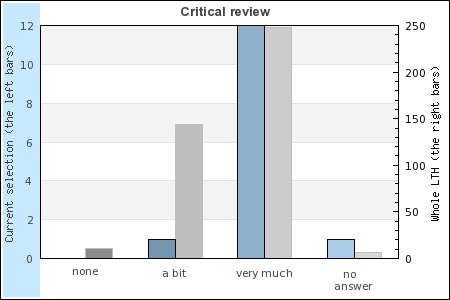 |
| A bit | 1 | 7% | |
| Very much | 12 | 86% | |
| No answer | 1 | 7% |
| Number | Part | ||
|---|---|---|---|
| None | 0 | 0% | 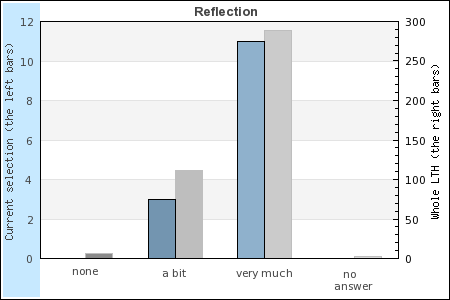 |
| A bit | 3 | 21% | |
| Very much | 11 | 79% | |
| No answer | 0 | 0% |
| Number | Part | ||
|---|---|---|---|
| None | 0 | 0% | 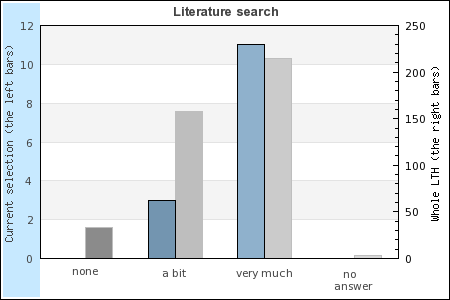 |
| A bit | 3 | 21% | |
| Very much | 11 | 79% | |
| No answer | 0 | 0% |
| Number | Part | ||
|---|---|---|---|
| None | 0 | 0% | 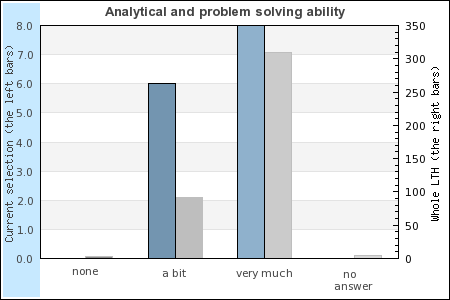 |
| A bit | 6 | 43% | |
| Very much | 8 | 57% | |
| No answer | 0 | 0% |
| Number | Part | ||
|---|---|---|---|
| Dissatisfied | 0 | 0% | 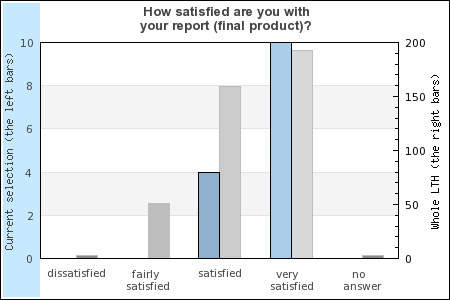 |
| Fairly satisfied | 0 | 0% | |
| Satisfied | 4 | 29% | |
| Very satisfied | 10 | 71% | |
| No answer | 0 | 0% |
| Number | Part | ||
|---|---|---|---|
| Dissatisfied | 0 | 0% | 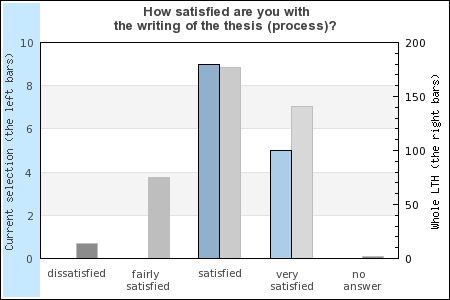 |
| Fairly satisfied | 0 | 0% | |
| Satisfied | 9 | 64% | |
| Very satisfied | 5 | 36% | |
| No answer | 0 | 0% |
| Number | Part | ||
|---|---|---|---|
| Dissatisfied | 1 | 7% | 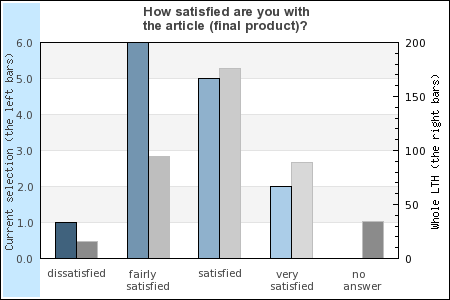 |
| Fairly satisfied | 6 | 43% | |
| Satisfied | 5 | 36% | |
| Very satisfied | 2 | 14% | |
| No answer | 0 | 0% |
| Number | Part | ||
|---|---|---|---|
| Dissatisfied | 0 | 0% | 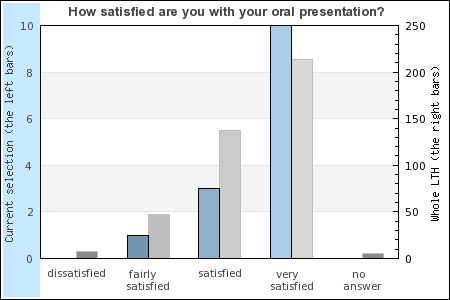 |
| Fairly satisfied | 1 | 7% | |
| Satisfied | 3 | 21% | |
| Very satisfied | 10 | 71% | |
| No answer | 0 | 0% |
| Number | Part | ||
|---|---|---|---|
| Dissatisfied | 1 | 7% | 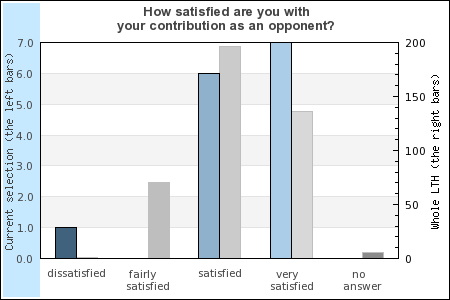 |
| Fairly satisfied | 0 | 0% | |
| Satisfied | 6 | 43% | |
| Very satisfied | 7 | 50% | |
| No answer | 0 | 0% |
| Number | Part | ||
|---|---|---|---|
| Dissatisfied | 1 | 7% | 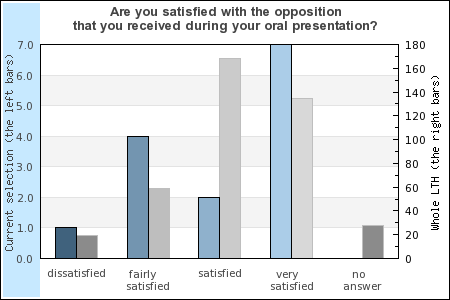 |
| Fairly satisfied | 4 | 29% | |
| Satisfied | 2 | 14% | |
| Very satisfied | 7 | 50% | |
| No answer | 0 | 0% |
| Number | Part | ||
|---|---|---|---|
| Yes | 8 | 57% | 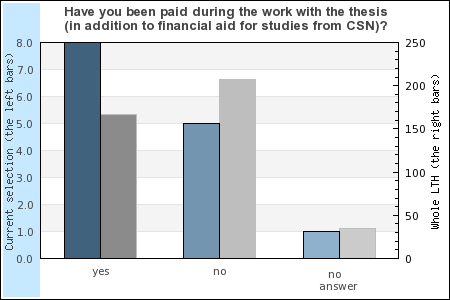 |
| No | 5 | 36% | |
| No answer | 1 | 7% |
| Number | Part | ||
|---|---|---|---|
| Yes | 13 | 93% | 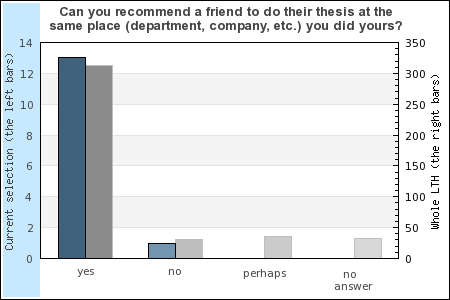 |
| No | 1 | 7% | |
| Perhaps | 0 | 0% | |
| No answer | 0 | 0% |